June 22, 2026 · Erik Rumbaugh
The Critical Role of Free Ammonia and Free Nitrous Acid in Maintaining AOB and NOB Populations
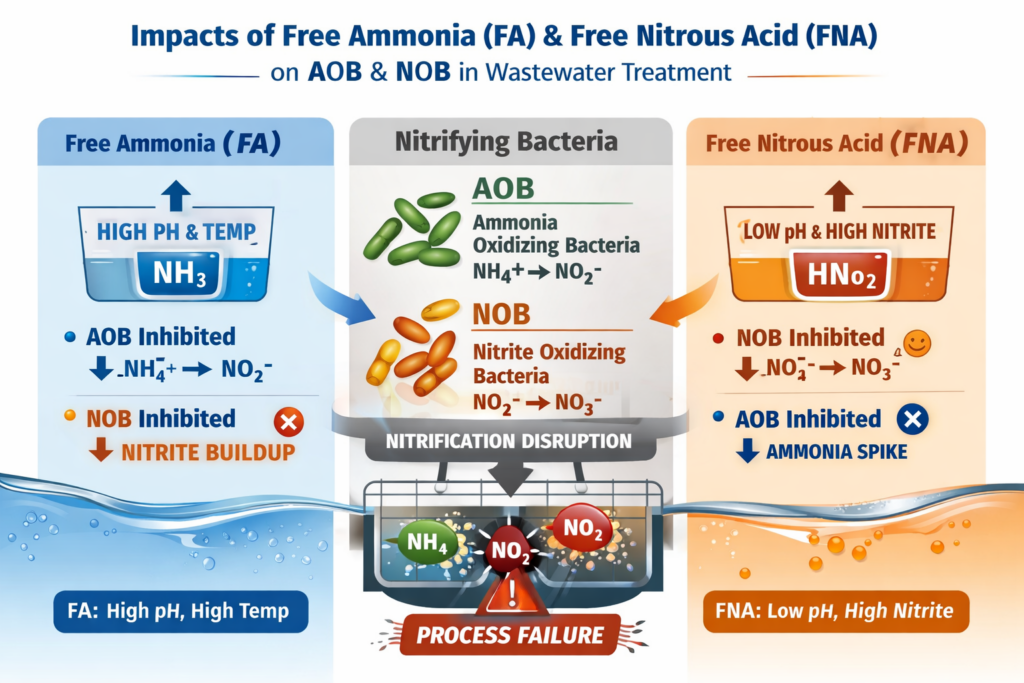
Nitrification is one of the most sensitive biological processes in wastewater treatment. The organisms responsible — Ammonia‑Oxidizing Bacteria (AOB) and Nitrite‑Oxidizing Bacteria (NOB) — operate within narrow chemical windows. Even small shifts in pH, alkalinity, or loading can push the system into conditions where free ammonia (FA) or free nitrous acid (FNA) rise to inhibitory levels.
Understanding FA and FNA isn’t just for laboratories. These two species determine whether nitrifiers thrive, stall, or crash.
What Are FA and FNA — and Why Do They Matter?
- Free Ammonia (NH₃) is the un‑ionized form of ammonia.
Its concentration increases with higher pH and higher temperature. - Free Nitrous Acid (HNO₂) is the protonated form of nitrite.
Its concentration increases with lower pH and higher nitrite levels.
Both are biocides at surprisingly low concentrations — especially for nitrifiers.
Inhibition Thresholds: How Sensitive Are AOB and NOB?
AOB Sensitivity
AOB are inhibited primarily by FA :
- 0.1–1.0 mg/L FA → measurable AOB inhibition
- >1.0 mg/L FA → strong inhibition, reduced ammonia oxidation
- >10 mg/L FA → near‑complete AOB shutdown
NOB Sensitivity
NOB are inhibited by both FA and FNA — but FNA is the real killer :
- 0.02–0.2 mg/L FNA → strong NOB inhibition
- >0.5 mg/L FNA → NOB collapse likely
- 1–5 mg/L FA → NOB inhibition even when AOB still function
This explains why nitrite spikes often appear before ammonia spikes:
NOB fail first.
How FA and FNA Shape AOB/NOB Populations
1. High FA Selects for AOB and Suppresses NOB
When FA rises:
- AOB slow down but often survive
- NOB are strongly inhibited
- Result: nitrite accumulation
This is the classic pattern in:
- High‑pH aeration basins
- Warm summer conditions
- Plants with high ammonia loading
2. High FNA Selects Against NOB — Hard
FNA is the most potent inhibitor in the nitrification pathway.
Even tiny increases in nitrite at low pH can create enough FNA to:
- Knock out NOB
- Reduce AOB activity
- Trigger nitrification collapse
3. Low FA + Low FNA = Stable Nitrification
When both species remain below inhibitory thresholds:
- AOB maintain steady ammonia oxidation
- NOB fully convert nitrite to nitrate
- Nitrification becomes predictable and resilient
Operational Conditions That Drive FA and FNA
FA increases when:
- pH rises above 7.5
- Temperature increases
- Ammonia loading spikes
- Aeration is insufficient (ammonia accumulates)
FNA increases when:
- pH drops below 6.8
- Nitrite accumulates
- DO is too low for NOB
- Sludge age is too short for slow‑growing nitrifiers
How Operators Can Control FA and FNA
Adjusting pH
- Keep pH 7.2 – 7.7 for optimal nitrifier stability
- Avoid high pH (>8.0) that elevates FA
- Avoid low pH (<6.6) that elevates FNA
Managing DO
- Maintain 2.0 mg/L DO in nitrification zones
- Prevent nitrite accumulation that drives FNA formation
Controlling SRT
- Maintain sufficient sludge age for slow‑growing NOB
- Avoid wasting too aggressively during warm weather
Balancing Loading
- Spread high‑strength loads
- Use equalization where possible
- Monitor ammonia peaks during morning and evening flows
What Happens When FA or FNA Get Out of Balance?
High FA → Nitrite Accumulation
- AOB slow down
- NOB nearly stop
- Nitrite rises
- FNA increases
- Full nitrification collapse becomes likely
High FNA → NOB Crash
- NOB activity drops sharply
- AOB continue producing nitrite
- FNA rises further
- AOB eventually inhibited
- Ammonia breakthrough follows
This is why nitrite is the early warning sign for nitrification failure.
The Bottom Line
Free ammonia and free nitrous acid are not side metrics — they are control points for the entire nitrification process. Plants that monitor FA and FNA can:
- Predict nitrification instability before it happens
- Protect AOB and NOB populations
- Prevent nitrite spikes and permit violations
- Maintain stable, resilient nitrogen removal year‑round
FA and FNA are the “invisible levers” of nitrification. When operators understand them, they gain real control over biological performance. Aster Bio has created a convenient Excel spreadsheet that can calculate your FA & FNA levels for your system. Just request it by email: info@asterbio.com and we will send it to you.