September 30, 2026 · Erik Rumbaugh
From Data Overload to Operational Clarity: Building a Wastewater Dashboard
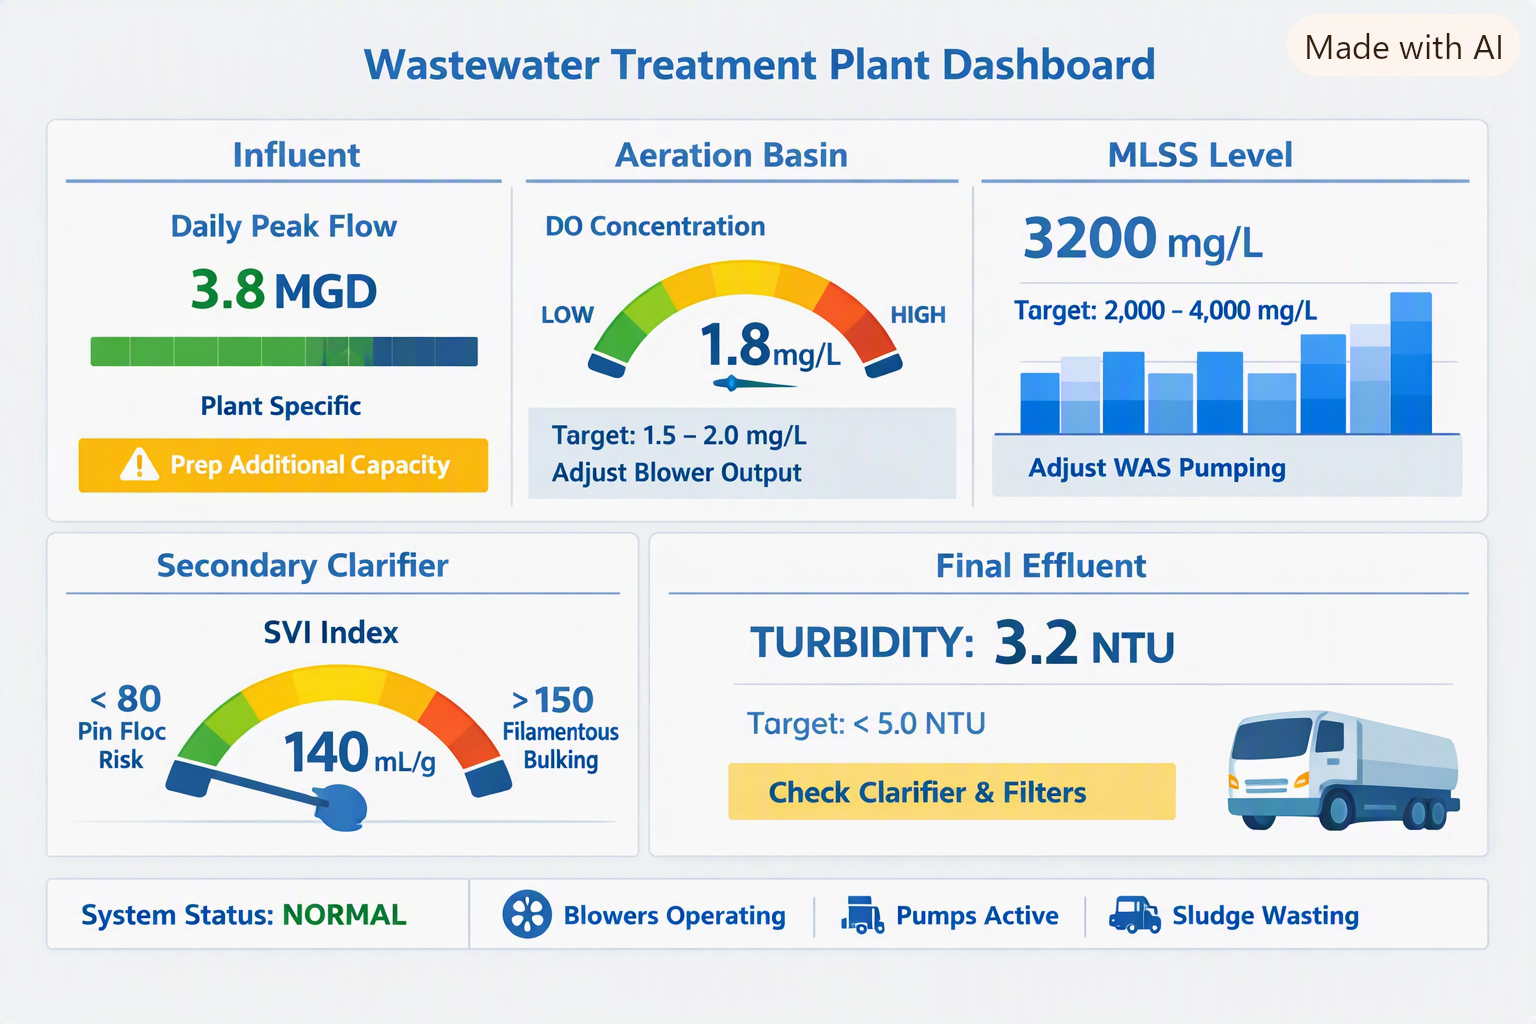
Data overload is a daily reality for wastewater treatment operators. When key operational parameters—such as Influent Flow, Mixed Liquor Suspended Solids (MLSS), Sludge Volume Index (SVI), and Effluent Turbidity—are scattered across logbooks, lab software, and SCADA systems, identifying process shifts becomes unnecessarily difficult.
A centralized Wastewater Operational Dashboard solves this problem by bringing field observations and laboratory analysis into a single visual hub.
Key Components of an Operational Dashboard
To prevent visual clutter, structure the dashboard around critical process control zones:
-
Influent & Loading: Track incoming flow (MGD), BOD/COD, and Total Suspended Solids (TSS) to anticipate organic and hydraulic loading spikes.
-
Biological Treatment (Aeration / Secondary): Monitor Dissolved Oxygen (DO), MLSS, Dissolved Oxygen Uptake Rate (DOUR), and SVI to gauge biomass health and settling characteristics.
-
Clarification & Solids Handling: Keep tabs on sludge blanket depth, Return Activated Sludge (RAS) rates, and Waste Activated Sludge (WAS) volumes to maintain target Mean Cell Residence Time (MCRT).
-
Effluent Quality & Compliance: Maintain real-time visibility on final Turbidity, Total Nitrogen, Total Phosphorus, and Disinfection Residuals (Chlorine/UV transmittance) to ensure NPDES compliance.
Sample Dashboard Metric Matrix
| Process Zone | Key Metric | Target Range (Typical) | Action Trigger / Purpose |
|---|---|---|---|
| Influent | Daily Peak Flow | Plant Specific | Prep additional basin/clarifier capacity |
| Aeration Basin | DO Concentration | 1.5 – 2.0 mg/L | Adjust blower output to prevent over-aeration or septic conditions |
| Aeration Basin | MLSS | 2,000 – 4,000 mg/L | Adjust WAS pumping to maintain biomass age |
| Secondary Clarifier | SVI | 80 – 150 mL/g | <80: Pin floc risk; >150: Filamentous bulging risk |
| Final Effluent | Turbidity | < 5.0 NTU | High readings trigger immediate clarifier or filter checks |
Implementation Steps
1.Define Key Performance Indicators (KPIs): Avoid tracking non-actionable data.
Consult with shift supervisors and operators to identify the exact metrics used during shift handovers. Limit the main dashboard screen to 8–12 critical operational variables.
2.Standardize Data Entry Sources: Integrate field and lab workflows.
Map out where data originates. SCADA provides automated continuous data (flow, DO, turbidity), while lab results (BOD, TSS, SVI) require routine manual or LIMS input. Standardize entry timestamps to ensure alignment.
3.Establish Visual Alert Thresholds: Use conditional formatting.
Set clear warning and critical threshold boundaries for each metric. Use color-coded indicators (Green = Normal, Yellow = Approaching Limit, Red = Action Required) to immediately highlight process deviations.
4.Incorporate Trend Lines: Focus on rate of change.
Display a rolling 7-day or 24-hour mini-trend line alongside instant values. Single values can be misleading, but a sudden spike in SVI or a gradual drop in DO helps operators intervene before a permit violation occurs.
Streamlining Operations
By moving away from siloed spreadsheets and physical clipboards, a unified wastewater dashboard transforms complex, multi-source data into actionable operational insights. Operators spend less time searching for numbers and more time optimizing process performance.