We know the story: the diffuser grid was rated well in clean-water testing, but real basins rarely perform the same. This post explains why real-world oxygen transfer efficiency (OTE) commonly lands 40–70% below clean-water standard oxygen transfer efficiency (SOTE), and what to watch for in day-to-day operations.
Real-World OTE vs. Clean-Water SOTE: What to Expect
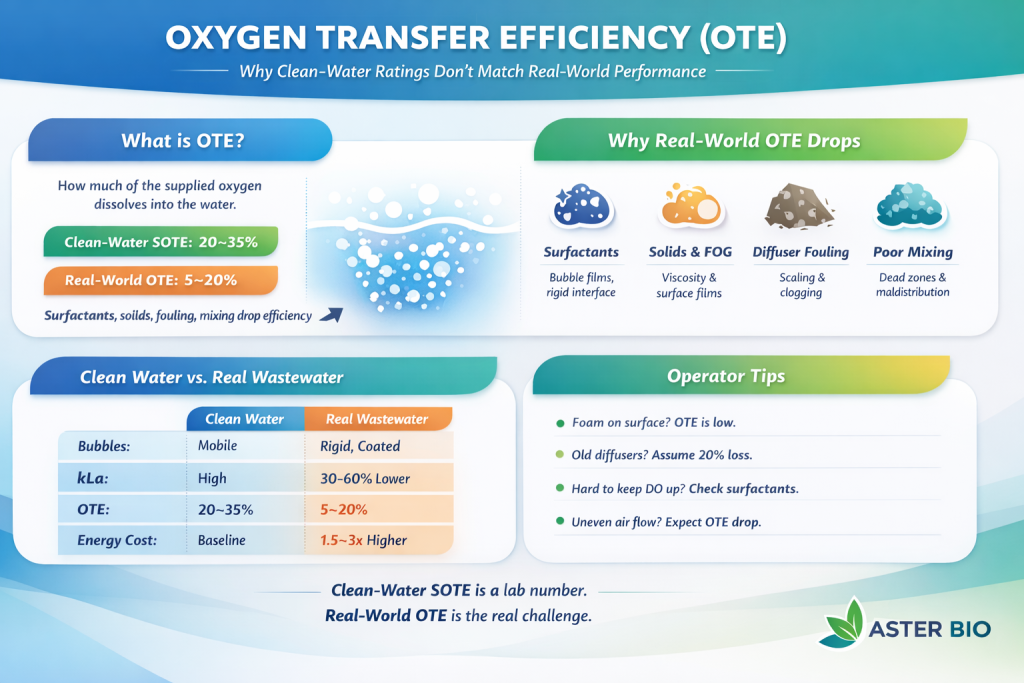
Fine-bubble diffuser systems often show 20–35% SOTE in clean-water testing (depth, diffuser type, and air flux dependent). In process conditions, effective OTE is commonly 10–20%—and can be lower—because wastewater changes bubble physics and the liquid-side mass transfer coefficient.
- Surfactants and organics suppress interfacial turbulence, reducing the liquid-side mass transfer coefficient (kL)—reported reductions can be up to ~70% under surfactant-rich conditions.
- Compared to clean water, wastewater commonly shows a 40–70% reduction in oxygen transfer performance due to surfactants, colloids, and mixed liquor effects.
- Diffuser fouling and aging (biofilm, scaling, solids) often drive an additional ~20–30% OTE loss over time if not corrected.
- Hydraulics matter: uneven airflow distribution, short-circuiting, and solids loading can depress transfer in parts of the basin while wasting energy in others.
Field takeaway: If your system is rated at 30% clean-water SOTE, a realistic process OTE is often ~9–18%, and it can drop below 10% in high-surfactant or heavily fouled conditions.
Real-World Factors That Depress OTE
1) Diffuser fouling and membrane aging
Biofilm, scaling, and solids cause:
- Larger bubbles
- Higher backpressure
- Performance impact: ~15–20% OTE loss is commonly reported as membranes foul; older membranes (multi-year service) can show ~20% lower OTE than new ones.
2) Uneven airflow distribution
Creates:
- Overaerated zones (wasted energy)
- Under-aerated zones (low DO, nitrification stress, and higher filament risk)
3) SRT and nitrification state
Plants running stable nitrification (often at higher SRT) may see better oxygen transfer than low-SRT, carbon-removal-only operation. The mixed liquor “feel” and surfactant loading are different—and OTE can move with it.
4) Wastewater chemistry (FOG, colloids, industrial inputs)
- FOG, long‑chain fatty acids, and colloids form surface films that further suppress oxygen transfer (consistent with your lagoon work).
- Industrial surfactants (SDS, LAS, quats) are especially potent.
Diving Deeper into the Surfactant Effect
Surfactants (from industrial discharges, cleaning products, and some food-process streams) accumulate at the gas–liquid interface and change how bubbles behave. The result is often a big drop in oxygen transfer—even if the bubbles look “finer.”
What’s happening at the bubble surface:
- The bubble surface becomes “rigid.” Interfacial motion is dampened, so kL drops and oxygen transfer slows.
- Bubbles can get smaller without improving OTE. More surface area doesn’t help if kL collapses.
- Gas holdup may increase (more air retained in the water column), but it typically does not offset the kL loss.
- OTE can fall sharply as surfactant levels rise, especially as concentrations approach the critical micelle concentration (CMC) for the dominant surfactant mix.
Why “Finer Bubbles” Don’t Automatically Mean Better Transfer
In surfactant-rich mixed liquor, bubbles can develop a stagnant “cap” that limits renewal at the interface. So even with more interfacial area, the effective mass transfer rate can drop because kL is throttled.
Practical OTE Ranges You Can Use (Rule-of-Thumb)
| Condition | Expected OTE (%) | Notes |
| Clean water SOTE | 20–35% | Manufacturer rating |
| Typical municipal wastewater | 10–20% | 40–70% reduction from clean water |
| High surfactant loading | 5–12% | kₗ reduced up to 70% |
| Fouled diffusers | 8–15% | 20–30% loss from fouling |
| Aged membranes (>3 yrs) | 10–18% | 20% loss vs. new |
What This Means for Operators and Designers
If you want a realistic design OTE, assume:
- α‑factor = 0.4–0.6 for municipal wastewater
- α‑factor = 0.2–0.4 for industrial wastewater with surfactants
- Lower values for lagoons, high FOG, or high surfactant loading
These ranges align with the observed 40–70% reduction in oxygen transfer due to surfactants and wastewater effects.
A quick field checklist to troubleshoot low OTE
- Compare blower kW vs. DO response at similar load/SRT—if power rises and DO control gets “lazy,” suspect α decline or fouling.
- Check header pressure trends: rising pressure at the same air rate often points to fouling, blinded membranes, or plugged laterals.
- Look for airflow maldistribution: DO maps, basin mixing patterns, or observed dead zones usually indicate valving/header issues or diffuser density problems.
- Watch for surfactant/FOG indicators: persistent foam, slippery mixed liquor, unusual scum, or industrial cleaning discharges can correlate with sudden OTE drops.
- Validate with testing when stakes are high: off-gas testing or process-based assessments can quantify the gap between nameplate SOTE and actual OTE.
Bottom line: Clean-water SOTE is a useful baseline, but wastewater chemistry and hardware condition usually control what you actually get. If you plan and operate with a realistic α-factor—and routinely check fouling and airflow distribution—you’ll make better blower decisions, protect nitrification, and avoid chasing DO setpoints with energy.
References Used:
Prades-Mateu, O., Monrós-Andreu, G., Torró, S., Martínez-Cuenca, R., & Chiva, S. (2025). Effects of SDS Surfactant on Oxygen Transfer in a Fine-Bubble Diffuser Aeration Column. Water, 17(24), 3473. https://doi.org/10.3390/w17243473
Groves, K P, et al. “Evaluation of oxygen transfer efficiency and alpha-factor on a variety of diffused aeration systems.” Water Environment Research; (United States), vol. 64:5, . https://doi.org/10.2175/WER.64.5.5